ZHighCharts: Integrating ZK with Highcharts"
(Created page with "{{Template:Smalltalk_Author| |author= Alain Galdemas & Zied Zaim @NGI Maghreb |date= November 19, 2012 |version= Applicable to ZK 5.0 and later }} ==Introduction== The best way...") |
|||
| Line 9: | Line 9: | ||
In this small talk, I will introduce a new component, the ZHighCharts, based on Highcharts JS library. The ZHighCharts component offers an easy way for a person to create modern and intuitive charts. | In this small talk, I will introduce a new component, the ZHighCharts, based on Highcharts JS library. The ZHighCharts component offers an easy way for a person to create modern and intuitive charts. | ||
==Demo== | ==Demo== | ||
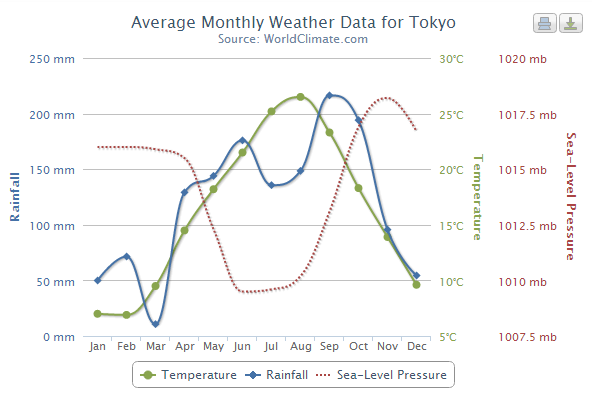
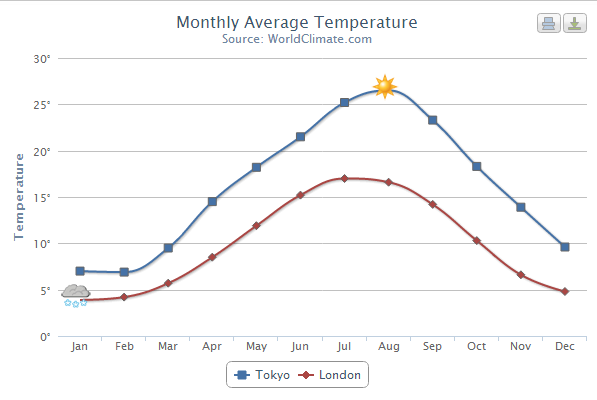
| − | + | Here are some selected demos: | |
| + | [[File:multiple-axis.png]] | ||
| + | [[File:Spline_w_symbols.png]] | ||
| + | More demos are available on this link: [http://zhighcharts.appspot.com/demo.zul http://zhighcharts.appspot.com/demo.zul] | ||
==Component Usage== | ==Component Usage== | ||
To create a chart, four steps are required: | To create a chart, four steps are required: | ||
Revision as of 05:10, 9 November 2012
Alain Galdemas & Zied Zaim @NGI Maghreb
November 19, 2012
Applicable to ZK 5.0 and later
Introduction
The best way to graphically represent data is to draw charts. Actually, ZK supports few types of charts based on JFreeChart library. In this small talk, I will introduce a new component, the ZHighCharts, based on Highcharts JS library. The ZHighCharts component offers an easy way for a person to create modern and intuitive charts.
Demo
Here are some selected demos:

 More demos are available on this link: http://zhighcharts.appspot.com/demo.zul
Component Usage
To create a chart, four steps are required:
- Add zhighcharts-0.2.0.jar to the directory WEB-INF/lib
- Add the ZHighCharts component to the ZUL file
<zhighcharts id="chartComp" />- Initialize and configure the component in the controller
ZHighCharts chartComp;

chartComp = (ZHighCharts) getFellow("chartComp");
chartComp.setTitle("My first ZHighChart chart");
chartComp.setType("line");- Add some data
SimpleExtXYModel dataChartModel = new SimpleExtXYModel();

chartComp.setModel(dataChartModel);

dataChartModel.addValue("Chart 1", 0, 7);
dataChartModel.addValue("Chart 1", 1, 4);
dataChartModel.addValue("Chart 1", 2, 9);
dataChartModel.addValue("Chart 1", 3, 5);
License
To use ZHighCharts, a valid Highcharts license is required. Note the use of Highcharts is free for non-profit organizations, students, universities, public schools and non-commercial personal websites. To use ZHighCharts for commercial services, a valid Highcharts license is required.
More informations are available on this link: Highcharts JS Licence.
Summary
Highcharts JS is considered as one of the best charting library written in JavaScript. The ZHighCharts project is trying to provide a pure Java approach to use Highcharts JS on ZK projects.
Comments
| Copyright © NGI Maghreb. This article is licensed under GNU Free Documentation License. |