Create your first ZK Charts
From Documentation
Revision as of 06:44, 5 March 2014 by Raymondchao (talk | contribs)
In the section we will show how to create your first ZK Charts component step by step.
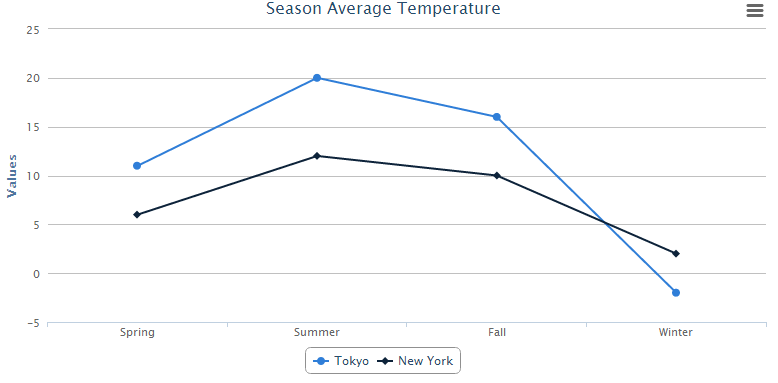
First, declare a chart component in a ZUML document. Assign type and title properties to it.
    <window apply="ChartComposer">
        <charts id="chart" type="line" title="Season Average Temperature" />
    </window>
Then specify chart data with model in the composer:
public class ChartComposer extends SelectorComposer<Window> {

    @Wire
    Charts chart;

    public void doAfterCompose(Window comp) throws Exception {
        super.doAfterCompose(comp);

        CategoryModel model = new SimpleCategoryModel();

        model.setValue("Tokyo", "Spring", new Integer(11));
        model.setValue("Tokyo", "Summer", new Integer(20));
        model.setValue("Tokyo", "Fall", new Integer(16));
        model.setValue("Tokyo", "Winter", new Integer(9));
        model.setValue("New York", "Spring", new Integer(6));
        model.setValue("New York", "Summer", new Integer(14));
        model.setValue("New York", "Fall", new Integer(8));
        model.setValue("New York", "Winter", new Integer(2));

        chart.setModel(model);
    }
}
After that, you can obtain an amazing chart to visualize your data.
< Get Complete Source Code of This Book >
