Chart"
From Documentation
Tmillsclare (talk | contribs) |
|||
| Line 128: | Line 128: | ||
| − | + | '''Description:''' Denotes user has clicked the component. | |
| − | <tt> | + | Use <tt>getX()</tt>, <tt>getY()</tt> method to get coordinates. |
| − | <tt> | + | Use <tt>getArea()</tt> method to get the UUID of the area component which user clicks on. |
| + | |||
| + | <source lang="java"> | ||
| + | void drilldown(MouseEvent event) { | ||
| + | final String areaid = event.getArea(); | ||
| + | if (areaid != null) { | ||
| + | Area area = (Area)desktop.getComponentByUuid() | ||
| + | Messagebox.show(area.getAttribute("entity")+": "+area.getTooltiptext()); | ||
| + | } | ||
| + | } | ||
| + | </source> | ||
|} | |} | ||
Revision as of 10:18, 11 August 2010
Chart
Employment/Purpose
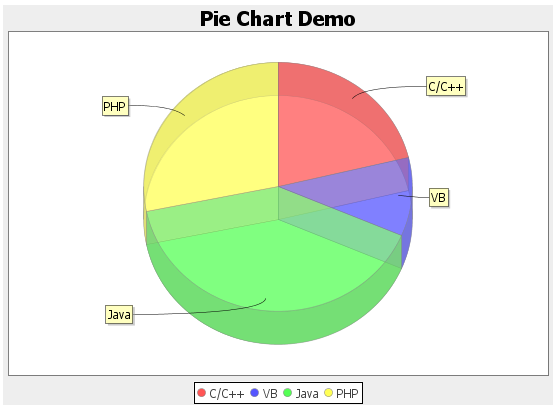
A chart is used to show a set of data as a graph. It helps users to judge things with a snapshot. To use a chart component , developers must prepare a ChartModel and a ChartEngine. Developers also set proper chart type, and the threeD (3D) attribute to draw proper chart. The model and type must match to each other; or the result is unpredictable. The 3D chart is not supported on all chart type.
Example
| PieModel | ||
| PieModel | ||
| CategoryModel | ||
| CategoryModel or XYModel | ||
| CategoryModel or XYModel | ||
| CategoryModel | ||
| CategoryModel or XYModel | ||
| CategoryModel | ||
| XYModel | ||
| XYModel | ||
| XYModel | ||
| XYModel | ||
| XYModel | ||
| XYModel | ||
| XYModel | ||
| HiLoModel | ||
| HiLoModel |
<vbox>
     <chart id="mychart" title="Pie Chart Demo" width="500" height="250" type="pie" threeD="true" fgAlpha="128"/>
     <zscript>
         PieModel model = new MyPieModel();
         mychart.setModel(model);
     </zscript>
 </vbox>
Supported events
| MouseEvent
Use getX(), getY() method to get coordinates. Use getArea() method to get the UUID of the area component which user clicks on. void drilldown(MouseEvent event) {
final String areaid = event.getArea();
if (areaid != null) {
Area area = (Area)desktop.getComponentByUuid()
Messagebox.show(area.getAttribute("entity")+": "+area.getTooltiptext());
}
}
|
Supported Children
*NONE
Use cases
| Version | Description | Example Location |
|---|---|---|
| 5.0 | Make a Chart fill 100% width in parent panel | http://www.zkoss.org/forum/listComment/10761 |
| 5.0 | Dual axis in Chart | http://www.zkoss.org/forum/listComment/8752 |
Version History
| Version | Date | Content |
|---|---|---|
