Introduction of FlashChart
Joy Lo, Engineer, Potix Corporation
December 8, 2009
ZK 5.0.0
Overview
The FlashChart is a new component which integrates the astra flash charting components with ZK. The technology makes use of Flash to draw charts and enables the user can customize the style of charts such as bar or line colors.
FlashChart separates the presentation layer from the data, providing the user with a API to supply data in a clean MVC based manner. In addition updating the data dynamically provides a pleasant user experience as the visual display is updated immediately.
An Example of FlashChart
To use the FlashChart we need to prepare a ChartModel and then assign that model to the FlashChart.
Zul Code
You can create a ChartModel using zscript or writing Java code in the Composer. The following sections outline using ZUL and Java code to create a chart.
<flashchart id="chart" />
Zscript Code
In the Zscript tags we create a new ChartModel, set the values in the model and invoke the set model method of FlashChart.
<zscript>
	<![CDATA[
		Import org.zkoss.zul.*;

		SimplePieModel model = new SimplePieModel();
		model.setValue("Java", new Double(21.2));
		model.setValue("PHP", new Double(10.2));
		model.setValue("ASP", new Double(40.4));
		model.setValue("C++", new Double(28.2));
		chart.setModel(model);
	]]>
</zscript>
Java Code
You can also create the ChartModel in Java ZK Composer instead of writing it in the ZUL.
private FlashChart chart;
public void doAfterCompose(Component comp) throws Exception {
	super.doAfterCompose(comp);
	SimplePieModel model = new SimplePieModel();
        model.setValue("Java", new Double(21.2));
	model.setValue("PHP", new Double(10.2));
	model.setValue("ASP", new Double(40.4));
	model.setValue("C++", new Double(28.2));
	chart.setModel(model);
}
Then it will show on the page like this.
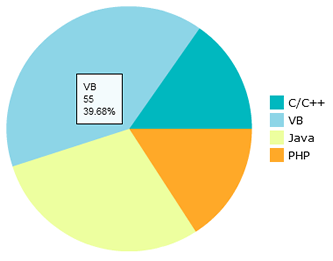

Characteristic of FlashChart
FlashChart is a Flash-based component, therefore it only loads charts.swf once and can draw any type of chart you require. The chart styles are also customizable, for example you are able to customize the legend and the axis colors. However, the user’s browser does require Adobe Flash Player to be installed Adobe Shockwave Player.
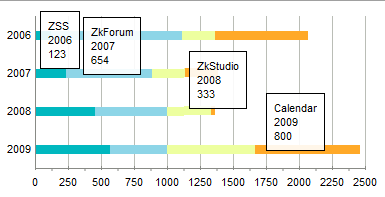
An Example of Stacked Charts
We support two stacked charts, stackedbarchart and stackedcolumnchart. These charts display multiple series providing the user with informative information in a clean manner. Below is a sample of how to draw a stackedbartchart.
ZUL Code
We are using a CategoryModel to create a StackedBarChart, you can declare the data model in the same manner as the PieChart. In the example below we initialize the data and assign the model in the ZUL file.
<flashchart id="chart" type="stackbar" />
<zscript>
	<![CDATA[
	    import org.zkoss.zul.*;
                SimpleCategoryModel demoStackedModel = new SimpleCategoryModel();
		demoStackedModel.setValue("ZSS", "2006", new Integer(123));
		demoStackedModel.setValue("ZSS", "2007", new Integer(234));
		demoStackedModel.setValue("ZSS", "2008", new Integer(456));
		demoStackedModel.setValue("ZSS", "2009", new Integer(567));
		demoStackedModel.setValue("ZkForum", "2006", new Integer(987));
		demoStackedModel.setValue("ZkForum", "2007", new Integer(654));
		demoStackedModel.setValue("ZkForum", "2008", new Integer(543));
		demoStackedModel.setValue("ZkForum", "2009", new Integer(432));
		demoStackedModel.setValue("ZkStudio", "2006", new Integer(250));
		demoStackedModel.setValue("ZkStudio", "2007", new Integer(250));
		demoStackedModel.setValue("ZkStudio", "2008", new Integer(333));
		demoStackedModel.setValue("ZkStudio", "2009", new Integer(666));
		demoStackedModel.setValue("Calendar", "2006", new Integer(710));
		demoStackedModel.setValue("Calendar", "2007", new Integer(250));
		demoStackedModel.setValue("Calendar", "2008", new Integer(30));
		demoStackedModel.setValue("Calendar", "2009", new Integer(800));
		chart.setModel(demoStackedModel);
	]]>
</zscript>

Java code
Flashchart will send an array of items to the widget, then the widget will convert the array to JSON data for use by the chart.swf. This is achieved by using the transferToJSONObject method, as the chart.swf only accepts JSON data.
private List transferToJSONObject(ChartModel model){
	LinkedList list = new LinkedList();
        ...
        _seriesList = new LinkedList();
	CategoryModel tempModel = (CategoryModel)model;
	for(int i = 0; i < tempModel.getCategories().size(); i++){
		Comparable series = tempModel.getSeries(i);
		JSONObject json = new JSONObject();
		json.put("xField", series);
		json.put("displayName", series);
		_seriesList.add(json);
	}
	for(int i = 0; i < tempModel.getCategories().size(); i++){
		Comparable category = tempModel.getCategory(i);
		JSONObject jData = new JSONObject();
		jData.put("verticalField", category);
		for(int j = 0; j < _seriesList.size(); j++){
			Comparable series = tempModel.getSeries(j);
			JSONObject temp = (JSONObject) _seriesList.get(j);
			jData.put(temp.get("xField"), tempModel.getValue(series, category));
		}
		list.add(jData);
	}
        ...
        return list;
}
Java Script Codes
Flashchart uses Jquery methods to transfer the data of the model, and prepare needed information such as the dataprovider. For charts.swf, the most important methods are setHorizontalAxis, setVerticalField and setDataProvider. Chart.swf will draw the correct diagram if these methods contain the correct values.
         ...
         var data = jq.evalJSON(wgt._jsonModel),
               type = wgt.type,
               dataProvider = [],
               axis = {
			stackingEnabled: true,
	    	        type: "numeric",
	    	        alwaysShowZero: true,
	    	        hideOverlappinLabels: true,
	    	        orientation: "horizontal",
	    	        reverse: false,
	    	        scale: "linear",
	    	        snapToUnits: true
	       };

         dataProvider = _seriesProvider(wgt, type, data, dataProvider);
         swf.setHorizontalAxis(axis);
	 swf.setVerticalField("verticalField");
         swf.setDataProvider(dataProvider);
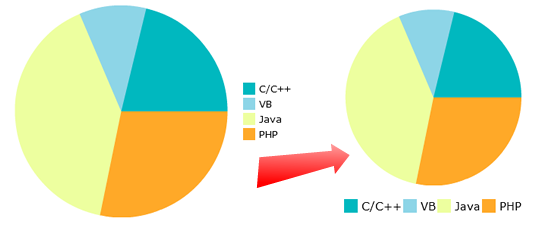
How to change the legend style
The Flashchart supports an attribute for setting the legend style of flashchart. The format is as follows CategoryName-Attribute=Value. Here is an example of styling a legend.
<flashchart id="chart" width="400px" height="300px" type="pie"
	chartStyle="legend-display=bottom,legend-padding=10,legend-spacing=5,legend-font-family=Arial,legend-font-size=15">
By setting the chartStyle attribute, the Flashchart will change the style to your specification.

Comments
| Copyright © Potix Corporation. This article is licensed under GNU Free Documentation License. |