Performance Monitoring"
| Line 43: | Line 43: | ||
Though <javadoc type="interface">org.zkoss.zk.ui.util.EventInterceptor</javadoc> is designed to allow developer to intercept how an event is processed, you could use it as callback to know how long it takes to process an event. The event processing time can be calculated by subtracting the time between <javadoc method="beforeProcessEvent(org.zkoss.zk.ui.event.Event)" type="interface">org.zkoss.zk.ui.util.EventInterceptor</javadoc> and <javadoc method="afterProcessEvent(org.zkoss.zk.ui.event.Event)" type="interface">org.zkoss.zk.ui.util.EventInterceptor</javadoc> | Though <javadoc type="interface">org.zkoss.zk.ui.util.EventInterceptor</javadoc> is designed to allow developer to intercept how an event is processed, you could use it as callback to know how long it takes to process an event. The event processing time can be calculated by subtracting the time between <javadoc method="beforeProcessEvent(org.zkoss.zk.ui.event.Event)" type="interface">org.zkoss.zk.ui.util.EventInterceptor</javadoc> and <javadoc method="afterProcessEvent(org.zkoss.zk.ui.event.Event)" type="interface">org.zkoss.zk.ui.util.EventInterceptor</javadoc> | ||
| + | |||
| + | Once implemented, you could register it by specifying the following in <tt>WEB-INF/zk.xml</tt> (assume the class is called foo.MyEventMeter): | ||
| + | |||
| + | <source lang="xml"> | ||
| + | <zk> | ||
| + | <listener> | ||
| + | <listener-class>foo.MyEventMeter</listener-class> | ||
| + | </listener> | ||
| + | </zk> | ||
| + | </source> | ||
=Loading Monitor= | =Loading Monitor= | ||
Revision as of 07:53, 29 November 2010
To improve the performance of an Ajax application, it is better to monitor the performance for identifying the bottleneck. Depending on the information you'd like to know, there are a few approaches.
- PerformanceMeter: Monitoring the performance from network speed, server-processing time and the client-rendering time.
- EventInterceptor: Monitoring the performance of each event listener.
- Monitor: Monitoring the number of desktops, sessions and other system load.
- There are a lot of performance monitor tools, such as VisualVM and JProfiler. They could provide more insightful view of your application.
Performance Meter
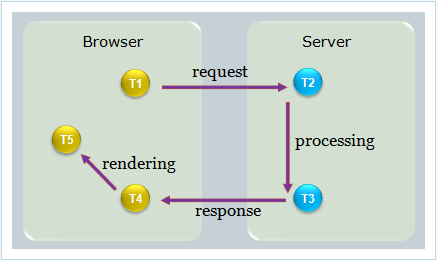
PerformanceMeter is a collection of callbacks that the implementation could know when a request is sent, arrives and is processed.
As show above, T1-T5 identifies the following callbacks.
- T1: PerformanceMeter.requestStartAtClient (String, Execution, long)
- T2: PerformanceMeter.requestStartAtServer(String, Execution, long)
- T3: PerformanceMeter.requestCompleteAtServer(String, Execution, long)
- T4: PerformanceMeter.requestReceiveAtClient(String, Execution, long)
- T5: PerformanceMeter.requestCompleteAtClient(String, Execution, long)
Thus,
- Server Execution Time: T3 - T2
- Client Execution Time: T5 - T4
- Network Latency Time: (T4 - T3) + (T2 - T1)
Notice that, when we make a connection to load a page for the first time, only Server Execution Time is available. T4 and T5 will be saved on the client side, and sent back along with the next request.
Once implemented, you could register it by specifying the following in WEB-INF/zk.xml (assume the class is called foo.MyMeter):
<zk>
    <listener>
        <listener-class>foo.MyMeter</listener-class>
    </listener>
</zk>
Event Interceptor
Though EventInterceptor is designed to allow developer to intercept how an event is processed, you could use it as callback to know how long it takes to process an event. The event processing time can be calculated by subtracting the time between EventInterceptor.beforeProcessEvent(Event) and EventInterceptor.afterProcessEvent(Event)
Once implemented, you could register it by specifying the following in WEB-INF/zk.xml (assume the class is called foo.MyEventMeter):
<zk>
    <listener>
        <listener-class>foo.MyEventMeter</listener-class>
    </listener>
</zk>
Loading Monitor
Further Reading
For sample implementations, you might take a look at the following articles:
- Performance Monitoring of ZK Applicaiton
- A ZK Performance Monitor
- Real-time Performance Monitoring of Ajax Event Handlers
Version History
| Version | Date | Content |
|---|---|---|
