Performance Meters"
From Documentation
m ((via JWB)) |
m (replace tt with code (via JWB)) |
||
| Line 20: | Line 20: | ||
Notice that, when we make a connection to load a page for the first time, only Server Execution Time is available. T4 and T5 will be saved on the client side, and sent back along with the next request. | Notice that, when we make a connection to load a page for the first time, only Server Execution Time is available. T4 and T5 will be saved on the client side, and sent back along with the next request. | ||
| − | Once implemented, you could register it by specifying the following in < | + | Once implemented, you could register it by specifying the following in <code>WEB-INF/zk.xml</code> (assume the class is called foo.MyMeter): |
<source lang="xml"> | <source lang="xml"> | ||
Revision as of 14:14, 12 January 2022
PerformanceMeter is a collection of callbacks that the implementation could know when a request is sent, arrives or is is processed.
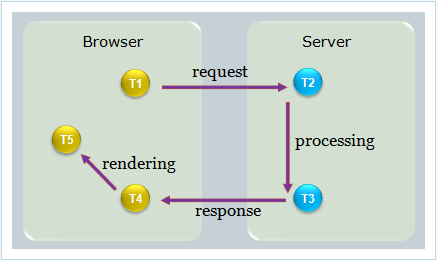
As show above, T1-T5 identifies the following callbacks.
- T1: PerformanceMeter.requestStartAtClient (String, Execution, long)
- T2: PerformanceMeter.requestStartAtServer(String, Execution, long)
- T3: PerformanceMeter.requestCompleteAtServer(String, Execution, long)
- T4: PerformanceMeter.requestReceiveAtClient(String, Execution, long)
- T5: PerformanceMeter.requestCompleteAtClient(String, Execution, long)
Thus,
- Server Execution Time: T3 - T2
- Client Execution Time: T5 - T4
- Network Latency Time: (T4 - T3) + (T2 - T1)
Notice that, when we make a connection to load a page for the first time, only Server Execution Time is available. T4 and T5 will be saved on the client side, and sent back along with the next request.
Once implemented, you could register it by specifying the following in WEB-INF/zk.xml (assume the class is called foo.MyMeter):
<zk>
    <listener>
        <listener-class>foo.MyMeter</listener-class>
    </listener>
</zk>
Version History
| Version | Date | Content |
|---|---|---|
