Chart
Available in ZK Spreadsheet EE only
Overview
Range API can allow you to add, move, and delete a charts of a Spreadsheet:
public Chart addChart(SheetAnchor anchor,ChartData data,Type type, Grouping grouping,
LegendPosition pos);

public void deleteChart(Chart chart);

public void moveChart(SheetAnchor anchor,Chart chart);
A chart is a simple object that you can only get its ID and position. Currently supported chart types are listed in Chart.Type which include AREA_3D, AREA, BAR_3D, BAR, BUBBLE, COLUMN, COLUMN_3D, DOUGHNUT, LINE_3D, LINE, OF_PIE, PIE_3D, PIE, RADAR, SCATTER, STOCK, SURFACE_3D, and SURFACE. Supported grouping(Chart.Grouping) are STANDARD, STACKED, PERCENT_STACKED and, CLUSTERED. Supported legend positions(Chart.LegendPosition) are BOTTOM, LEFT, RIGHT, TOP, and TOP_RIGHT.
The SheetAnchor represents a chart's position on a sheet. When adding or moving a chart, you must provide one SheetAnchor to assign a chart's position. You can create a SheetAnchor by passing 4 index numbers, left top corner's and right bottom's row and column of a chart. After you add a chart, you will get the newly-created Chart object. You had better store it somewhere you can retrieve it back later if you plan to delete or move it. Otherwise, you can only get them from a Sheet method:
public List<Chart> getCharts();
Then, use its ID or position to identify a chart.
We can create ChartData by passing a selection of a sheet and chart's type:
public class ChartDataUtil {
	public static ChartData getChartData(Sheet sheet, Rect selection, Type type){...}
...
}
The method will create a ChartData according to a predefined rule to detect which part of your selection is series and which part is label.
Example
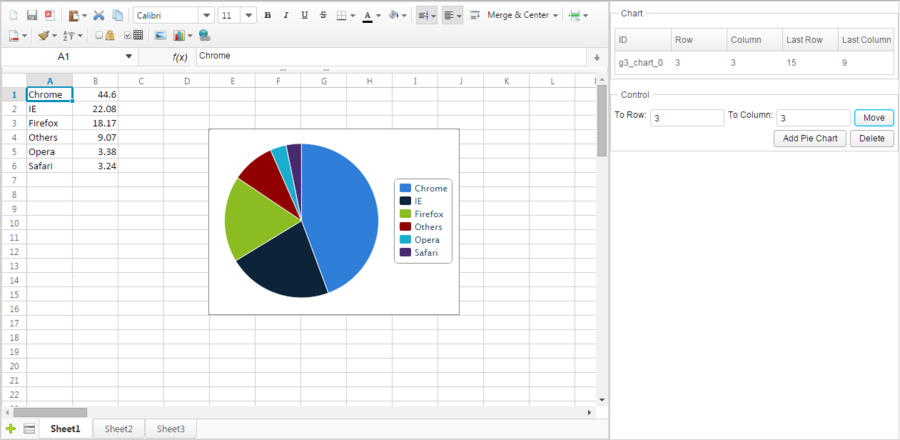
The screenshot below is a application that can add, move and delete a chart. For simplicity, this application only adds pie charts.
If we click "Add", it will add a pie chart with the data from A1:B6 and add a items in the Listbox on the top right corner. Select a chart item in the listbox, enter destination row and column index in 2 Intboxes, then click "Move". The selected chart will be moved to specified position. The "Delete" button will delete the selected chart.
Notice that there are 5 columns in the Listbox on the top right corner which display information about charts we add. The ID is a chart's ID generated automatically by Spreadsheet. The row and column represents a chart's position of the left top corner in 0-based index and the last row and last column represents symmetric position of a chart (right bottom corner). For example, in the screenshot, the topmost chart whose ID is "rid1", its left top corner is at "F1" represented in column index "5" and row index "0". Its right bottom corner is at "K9" represented in column index "10" and row index "8". in column index "1" and row index "6". Its right bottom corner is at "C12" represented in column index "11" and row index "2". These position information is stored in SheetAnchor. When adding or moving a picture, you must provide one SheetAnchor to assign a picture's position. The SheetOperationUtil provides methods to simplify this.
Let's see this application's controller codes:
public class ChartComposer extends SelectorComposer<Component> {

	@Wire
	private Intbox toRowBox;
	@Wire
	private Intbox toColumnBox;
	@Wire
	private Spreadsheet ss;
	@Wire
	private Listbox chartListbox;

	private ListModelList<Chart> chartList = new ListModelList<Chart>();

	@Listen("onClick = #addButton")
	public void addByUtil(){
		ChartData chartData = ChartDataUtil.getChartData(ss.getSelectedSheet(),
				new Rect("A1:B6"), Type.PIE);
		SheetOperationUtil.addChart(Ranges.range(ss.getSelectedSheet(),ss.getSelection()),
		chartData, Type.PIE, Grouping.STANDARD, LegendPosition.RIGHT);
		refreshChartList();
	}

	@Listen("onClick = #moveButton")
	public void moveByUtil(){
		if (chartListbox.getSelectedItem() != null){
			SheetOperationUtil.moveChart(Ranges.range(ss.getSelectedSheet()),
					(Chart)chartListbox.getSelectedItem().getValue(),
					toRowBox.getValue(), toColumnBox.getValue());
			refreshChartList();
		}
	}

	@Listen("onClick = #deleteButton")
	public void deleteByUtil(){
		if (chartListbox.getSelectedItem() != null){
			SheetOperationUtil.deleteChart(Ranges.range(ss.getSelectedSheet()),
					(Chart)chartListbox.getSelectedItem().getValue());
			refreshChartList();
		}
	}

	private void refreshChartList(){
		chartList.clear();
		chartList.addAll(ss.getSelectedSheet().getCharts());
		chartListbox.setModel(chartList);
	}
}
- Line 16: ChartDataUtil.getChartData() helps you convert a range of cells to chart data based on a general assumption. For example, it will assume that the first column contains category labels.
All source code listed in this book is at Github.
